Grafana
The prequel plugin for Grafana gives you the ability to view Prequel detections as annotations on Grafana dashboards.
It provides:
- an annotation data source
This plugin is presently for internal prequel use only and not to be distributed.
Prerequisites
- An existing Grafana installation (deployed with Helm)
- A prequel api token
- Plugin is not compatible with Grafana cloud
- If your Grafana install is not deployed with helm, you will need to make the grab the plugin binary and make the required .ini changes using your preferred method.
Installation via Helm
There are few ways to install the Grafana plugin, but these instructions focus on patching your Grafana install with Helm.
Create a values file
First you'll need to create a values.yaml file that -
- creates an init container that downloads the plugin into the appropriate location in Grafana
- patches
grafana.inito allow loading of this unsigned plugin
Here is an example that you can adjust as needed:
extraInitContainers:
  - name: install-prequel-plugin
    image: busybox:1.36
    command:
      - sh
      - -c
      - |
        echo "Installing Prequel plugin..."
        mkdir -p /var/lib/grafana/plugins
        wget -O /tmp/plugin.zip https://github.com/prequel-dev/prequel-grafana-datasource/releases/download/v1.0.0/prequel-prequel-datasource-1.0.0.zip
        unzip -o /tmp/plugin.zip -d /var/lib/grafana/plugins
    volumeMounts:
      - name: plugins
        mountPath: /var/lib/grafana/plugins

# EmptyDir volume for plugins
extraVolumes:
  - name: plugins
    emptyDir: {}

# Mount the volume into the main Grafana container
extraVolumeMounts:
  - name: plugins
    mountPath: /var/lib/grafana/plugins

# Allow unsigned plugin to load
grafana.ini:
  plugins:
    allow_loading_unsigned_plugins: prequel-prequel-datasource
This example uses the current plugin release. Feel free to update the script to what is most appropriate for your deployment.
Apply the patch
Run the following helm command to apply the patch.
helm upgrade my-grafana grafana/grafana \
  -n my-grafana \
  -f values.yaml
You will need to adjust the command if your namespace or release have non-default names.
Configure the plugin in Grafana
Once the plugin has been installed, pivot over to the Grafana UI to configure the plugin.
Add the Prequel Data Source
From the Grafana sidebar, navigate to Connections → Data sources.
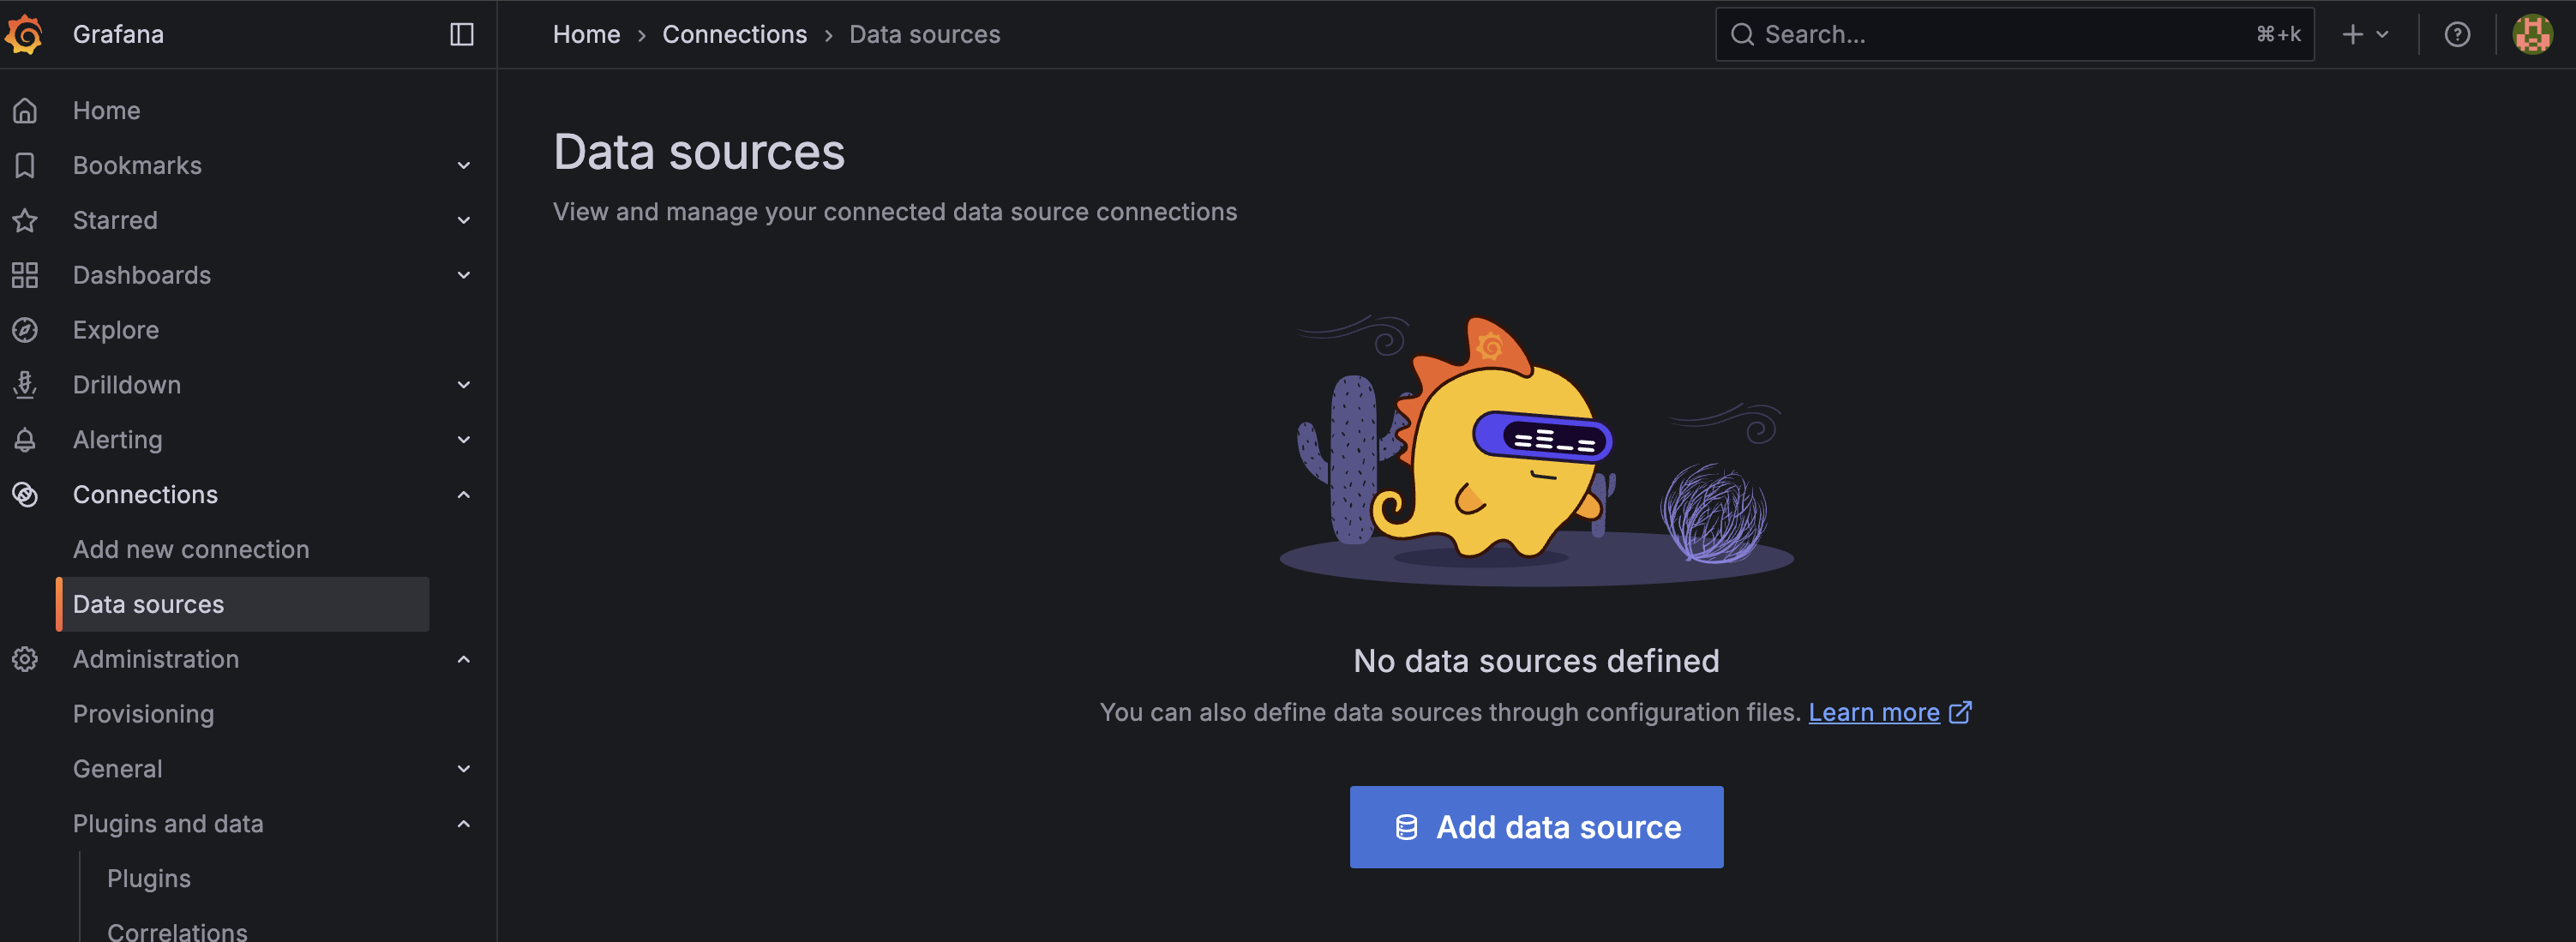
Click add data source.
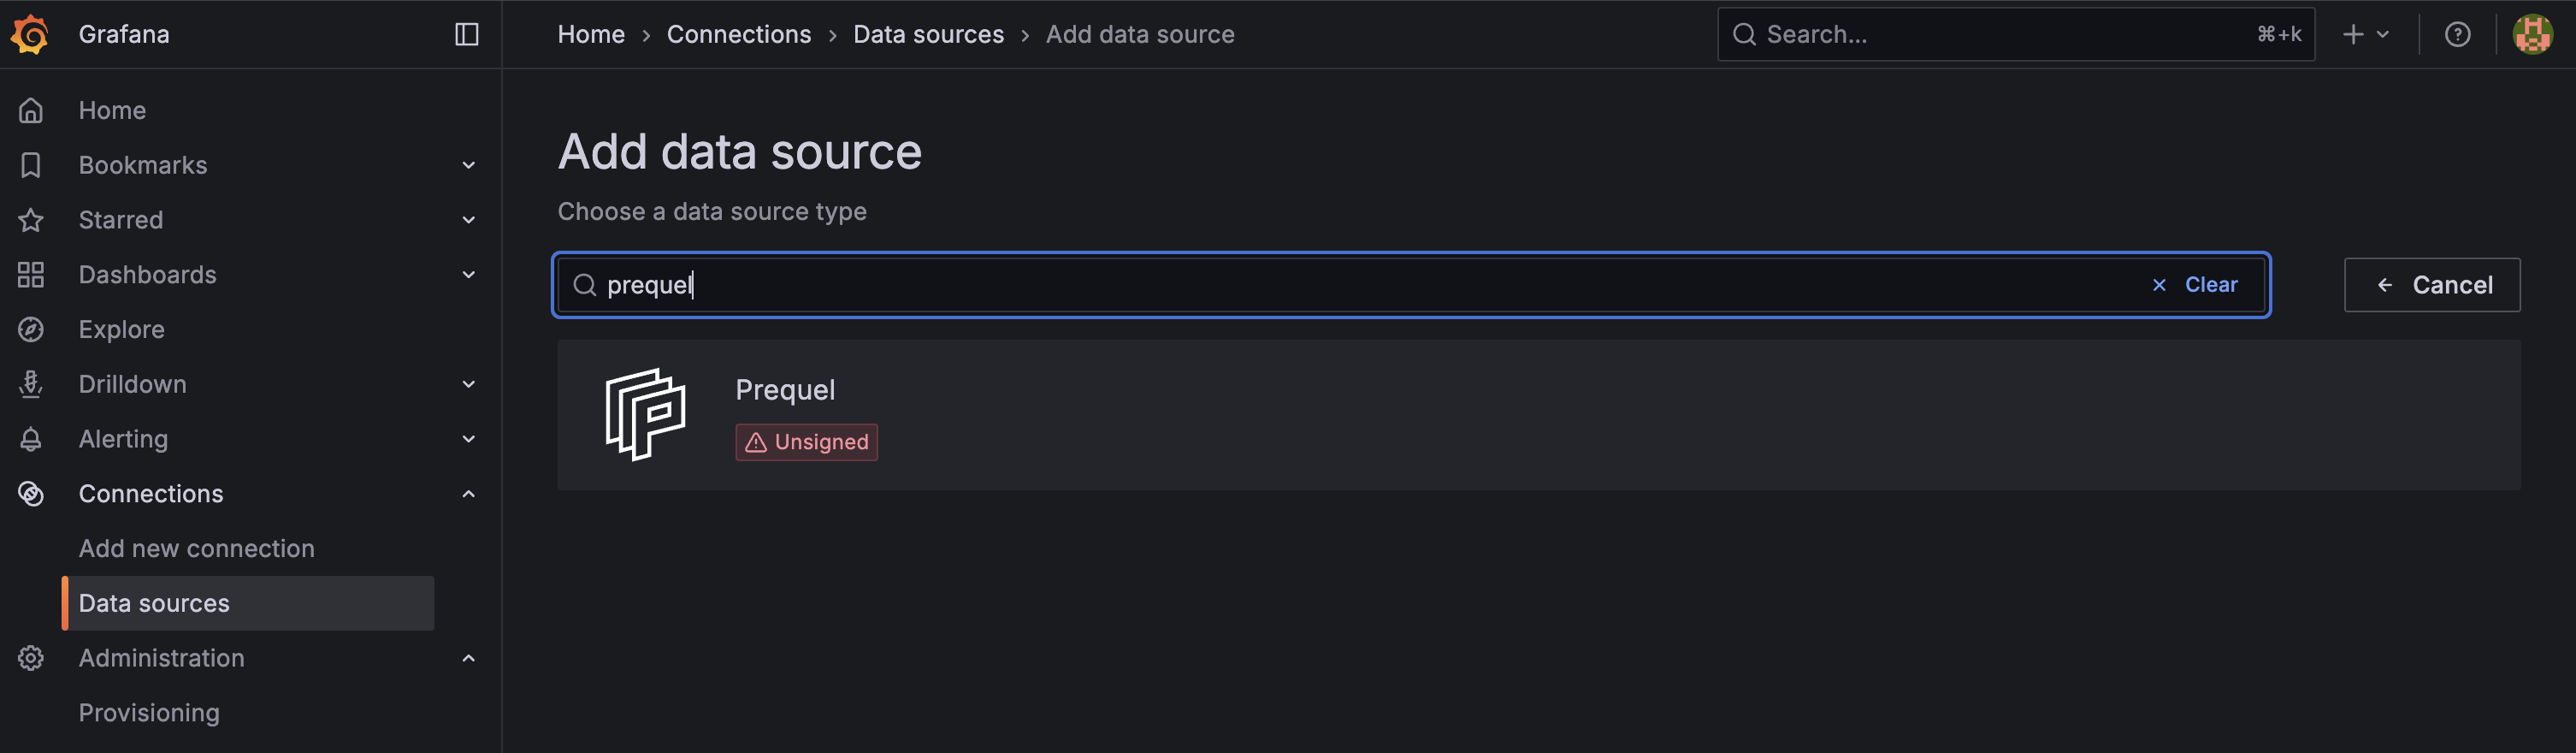
This will prompt you to choose a data source type.
In the search bar, type prequel and select the Prequel plugin from the list (you may see a warning about it being unsigned, which is expected for custom plugins).
Configure the Data Source
In the configuration form:
-
Name: Set a name for the data source (defaults to prequel-prequel-datasource).
-
URL: Enter the Prequel API endpoint (for example, https://app-beta.prequel.dev).
-
Token: Paste in your Prequel API token.
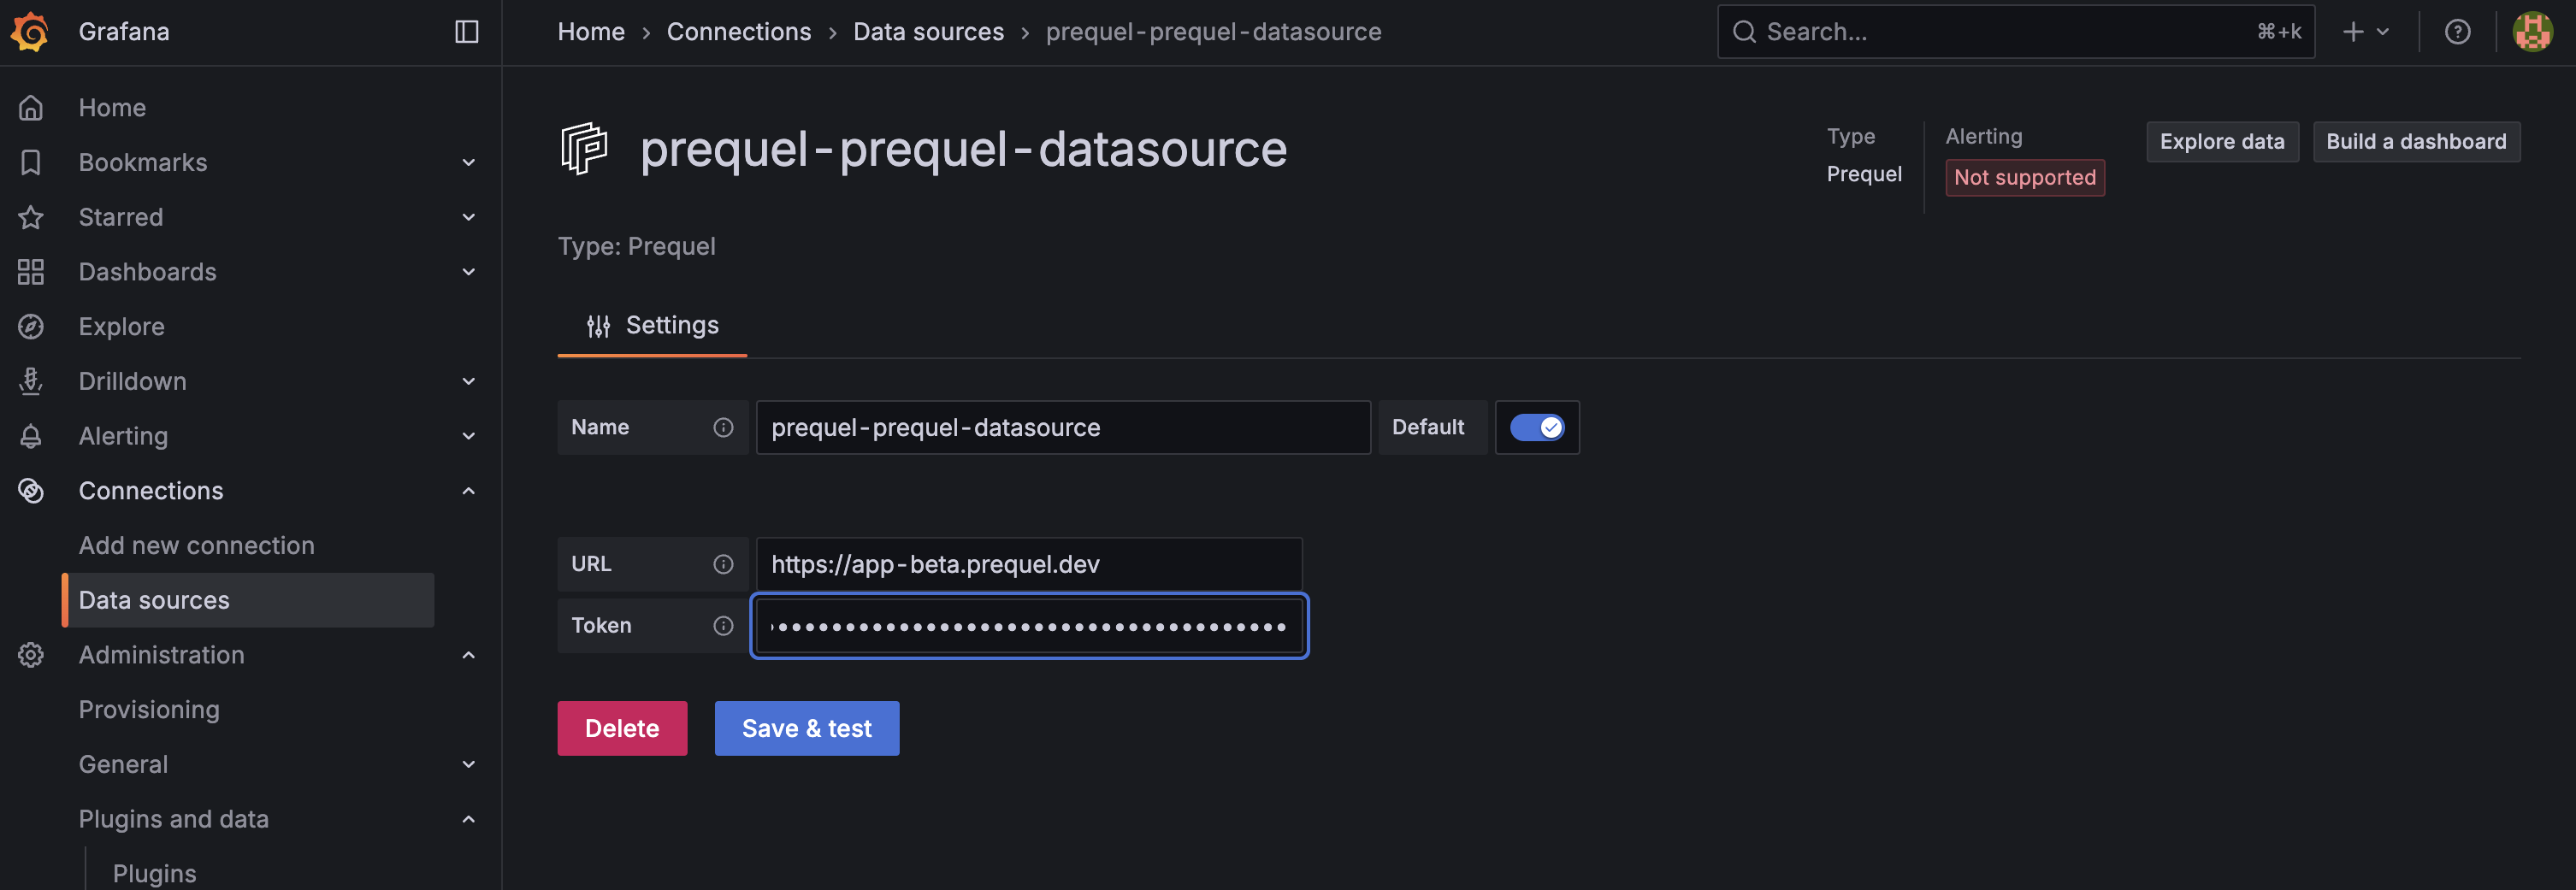
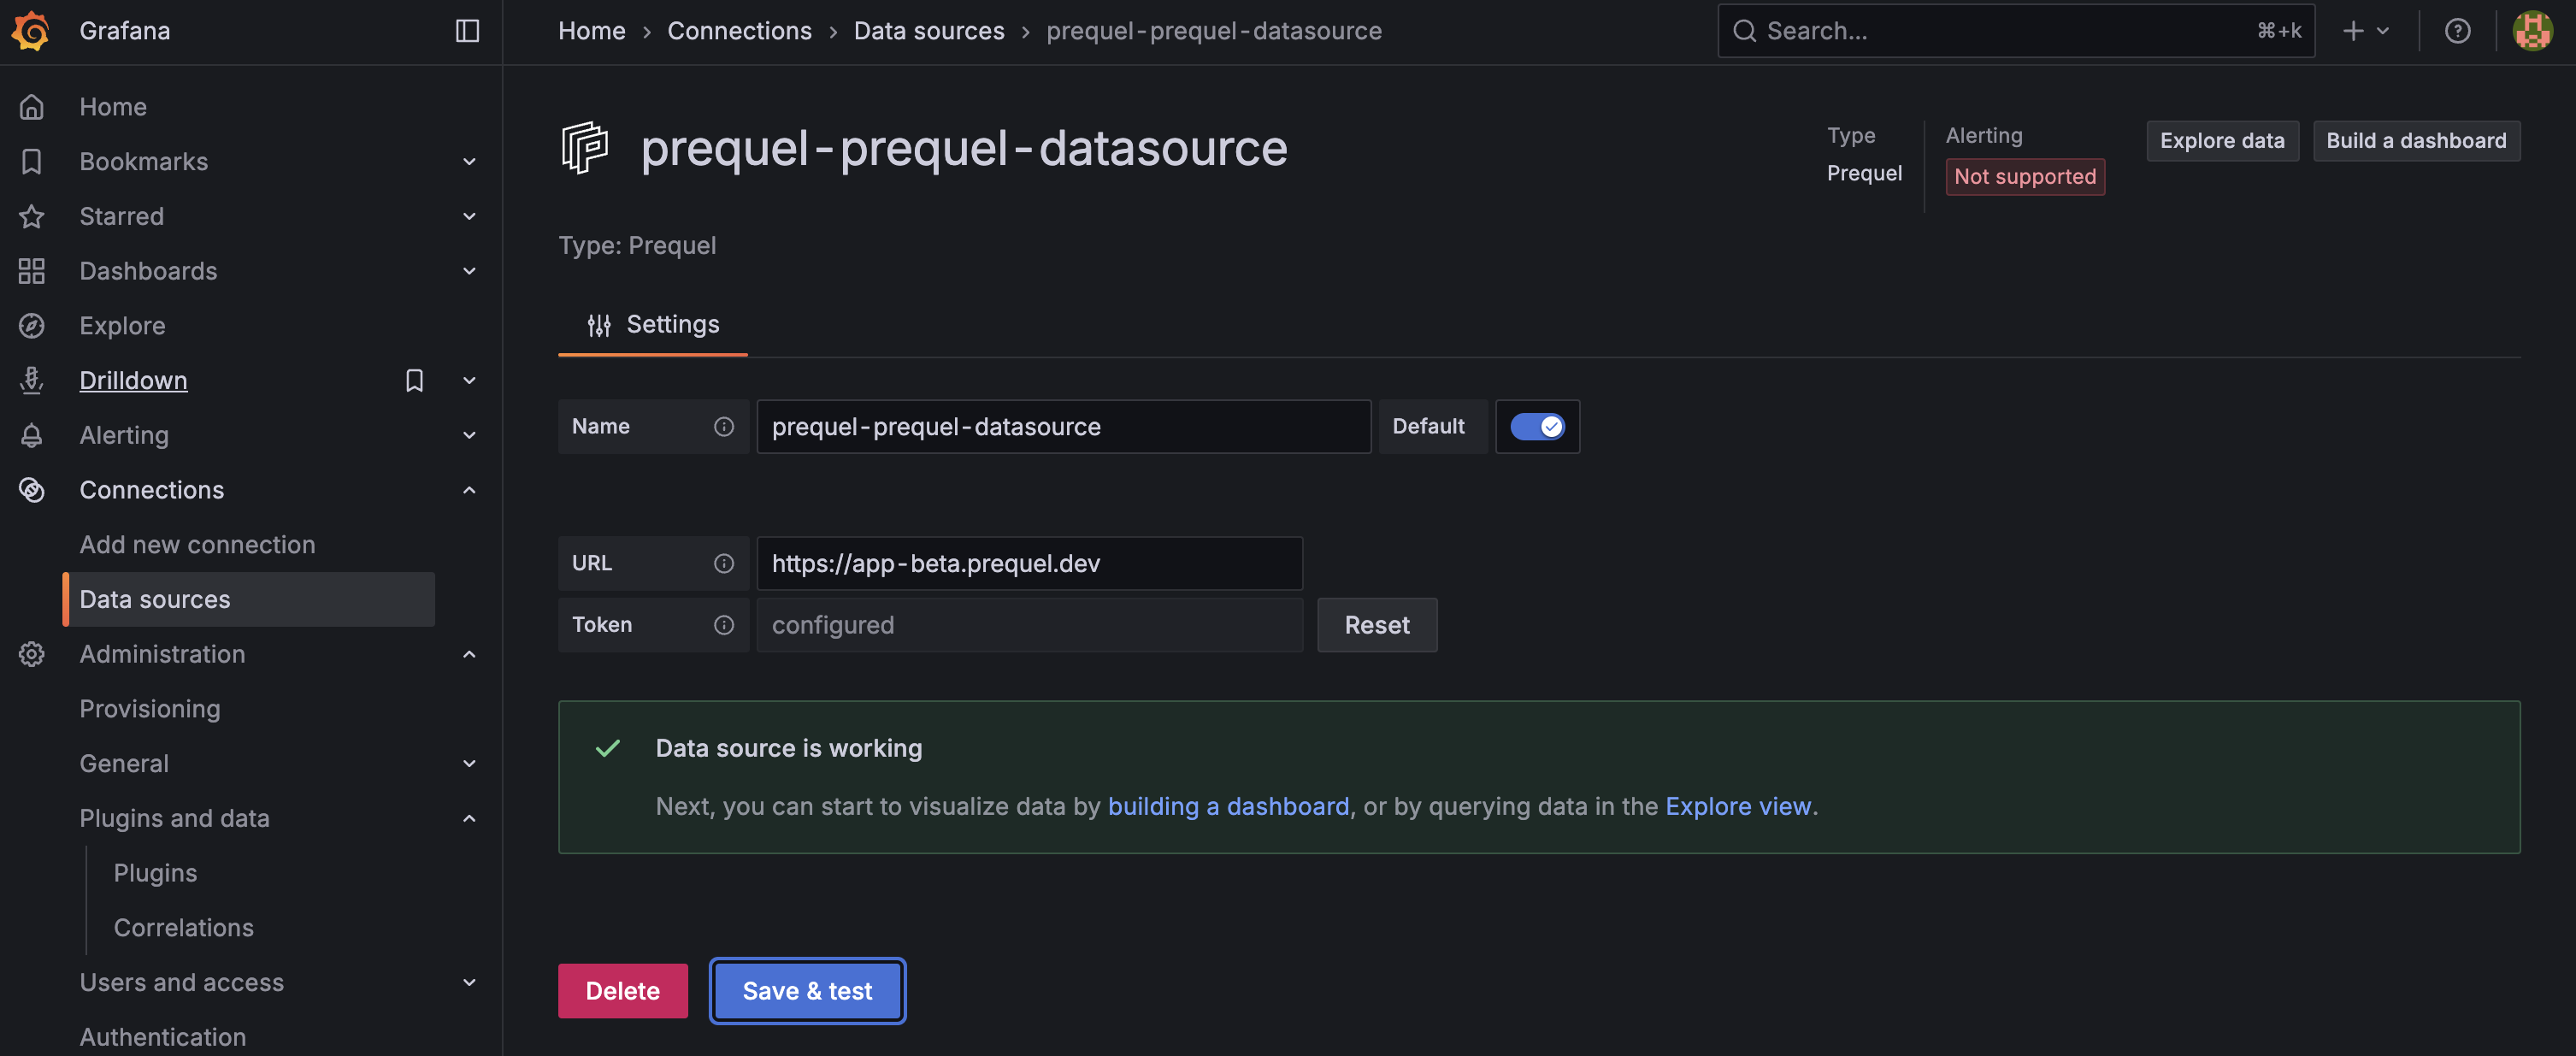
Click Save & test.
If successful, Grafana will confirm that the data source is working.
Add the data source to a dashboard
Now let's add prequel annotations to a dashboard.
Open an existing dashboard which contains panels you want to annotate.
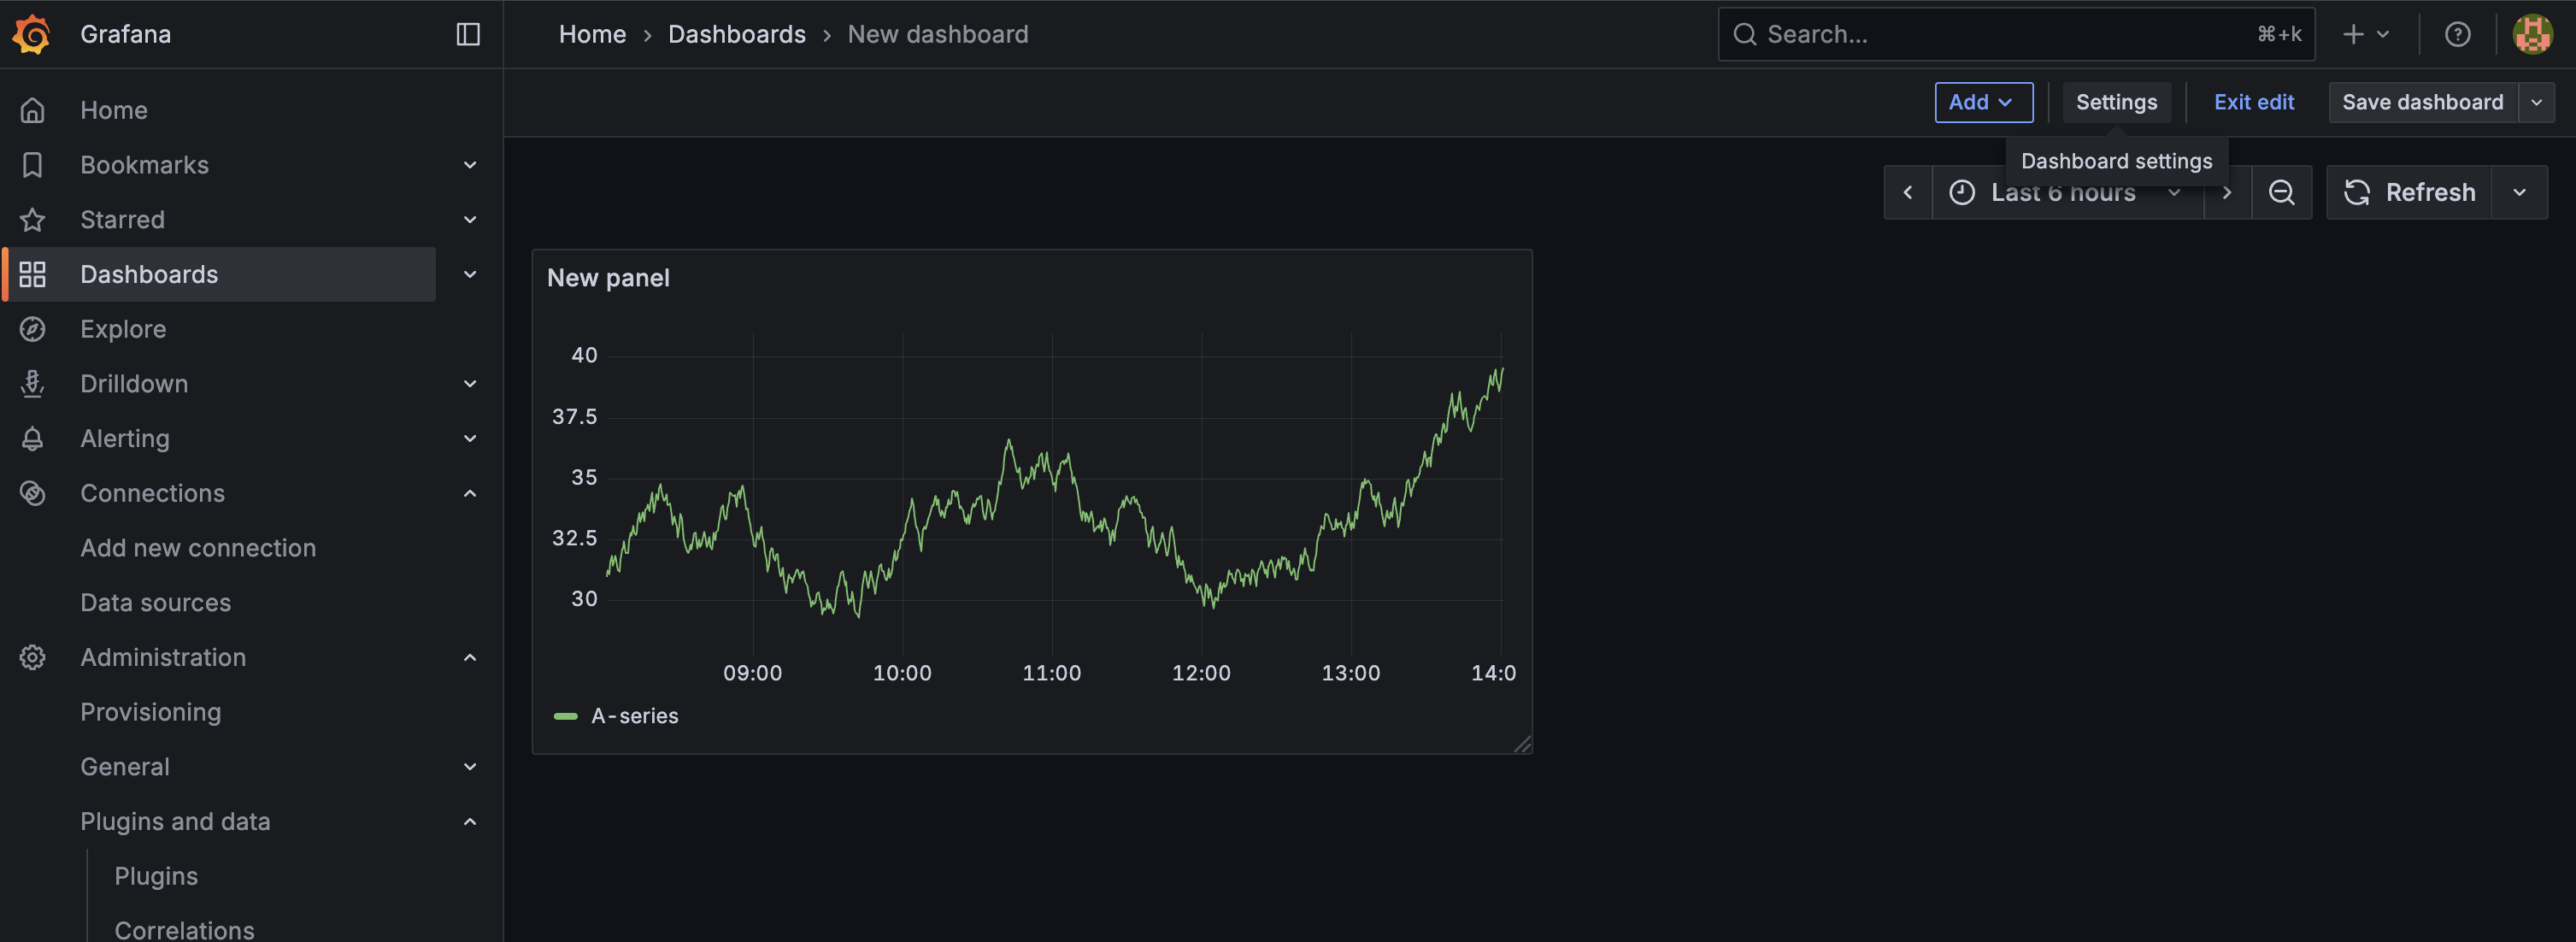
Click settings at the top of the screen.
Then, click annotations.
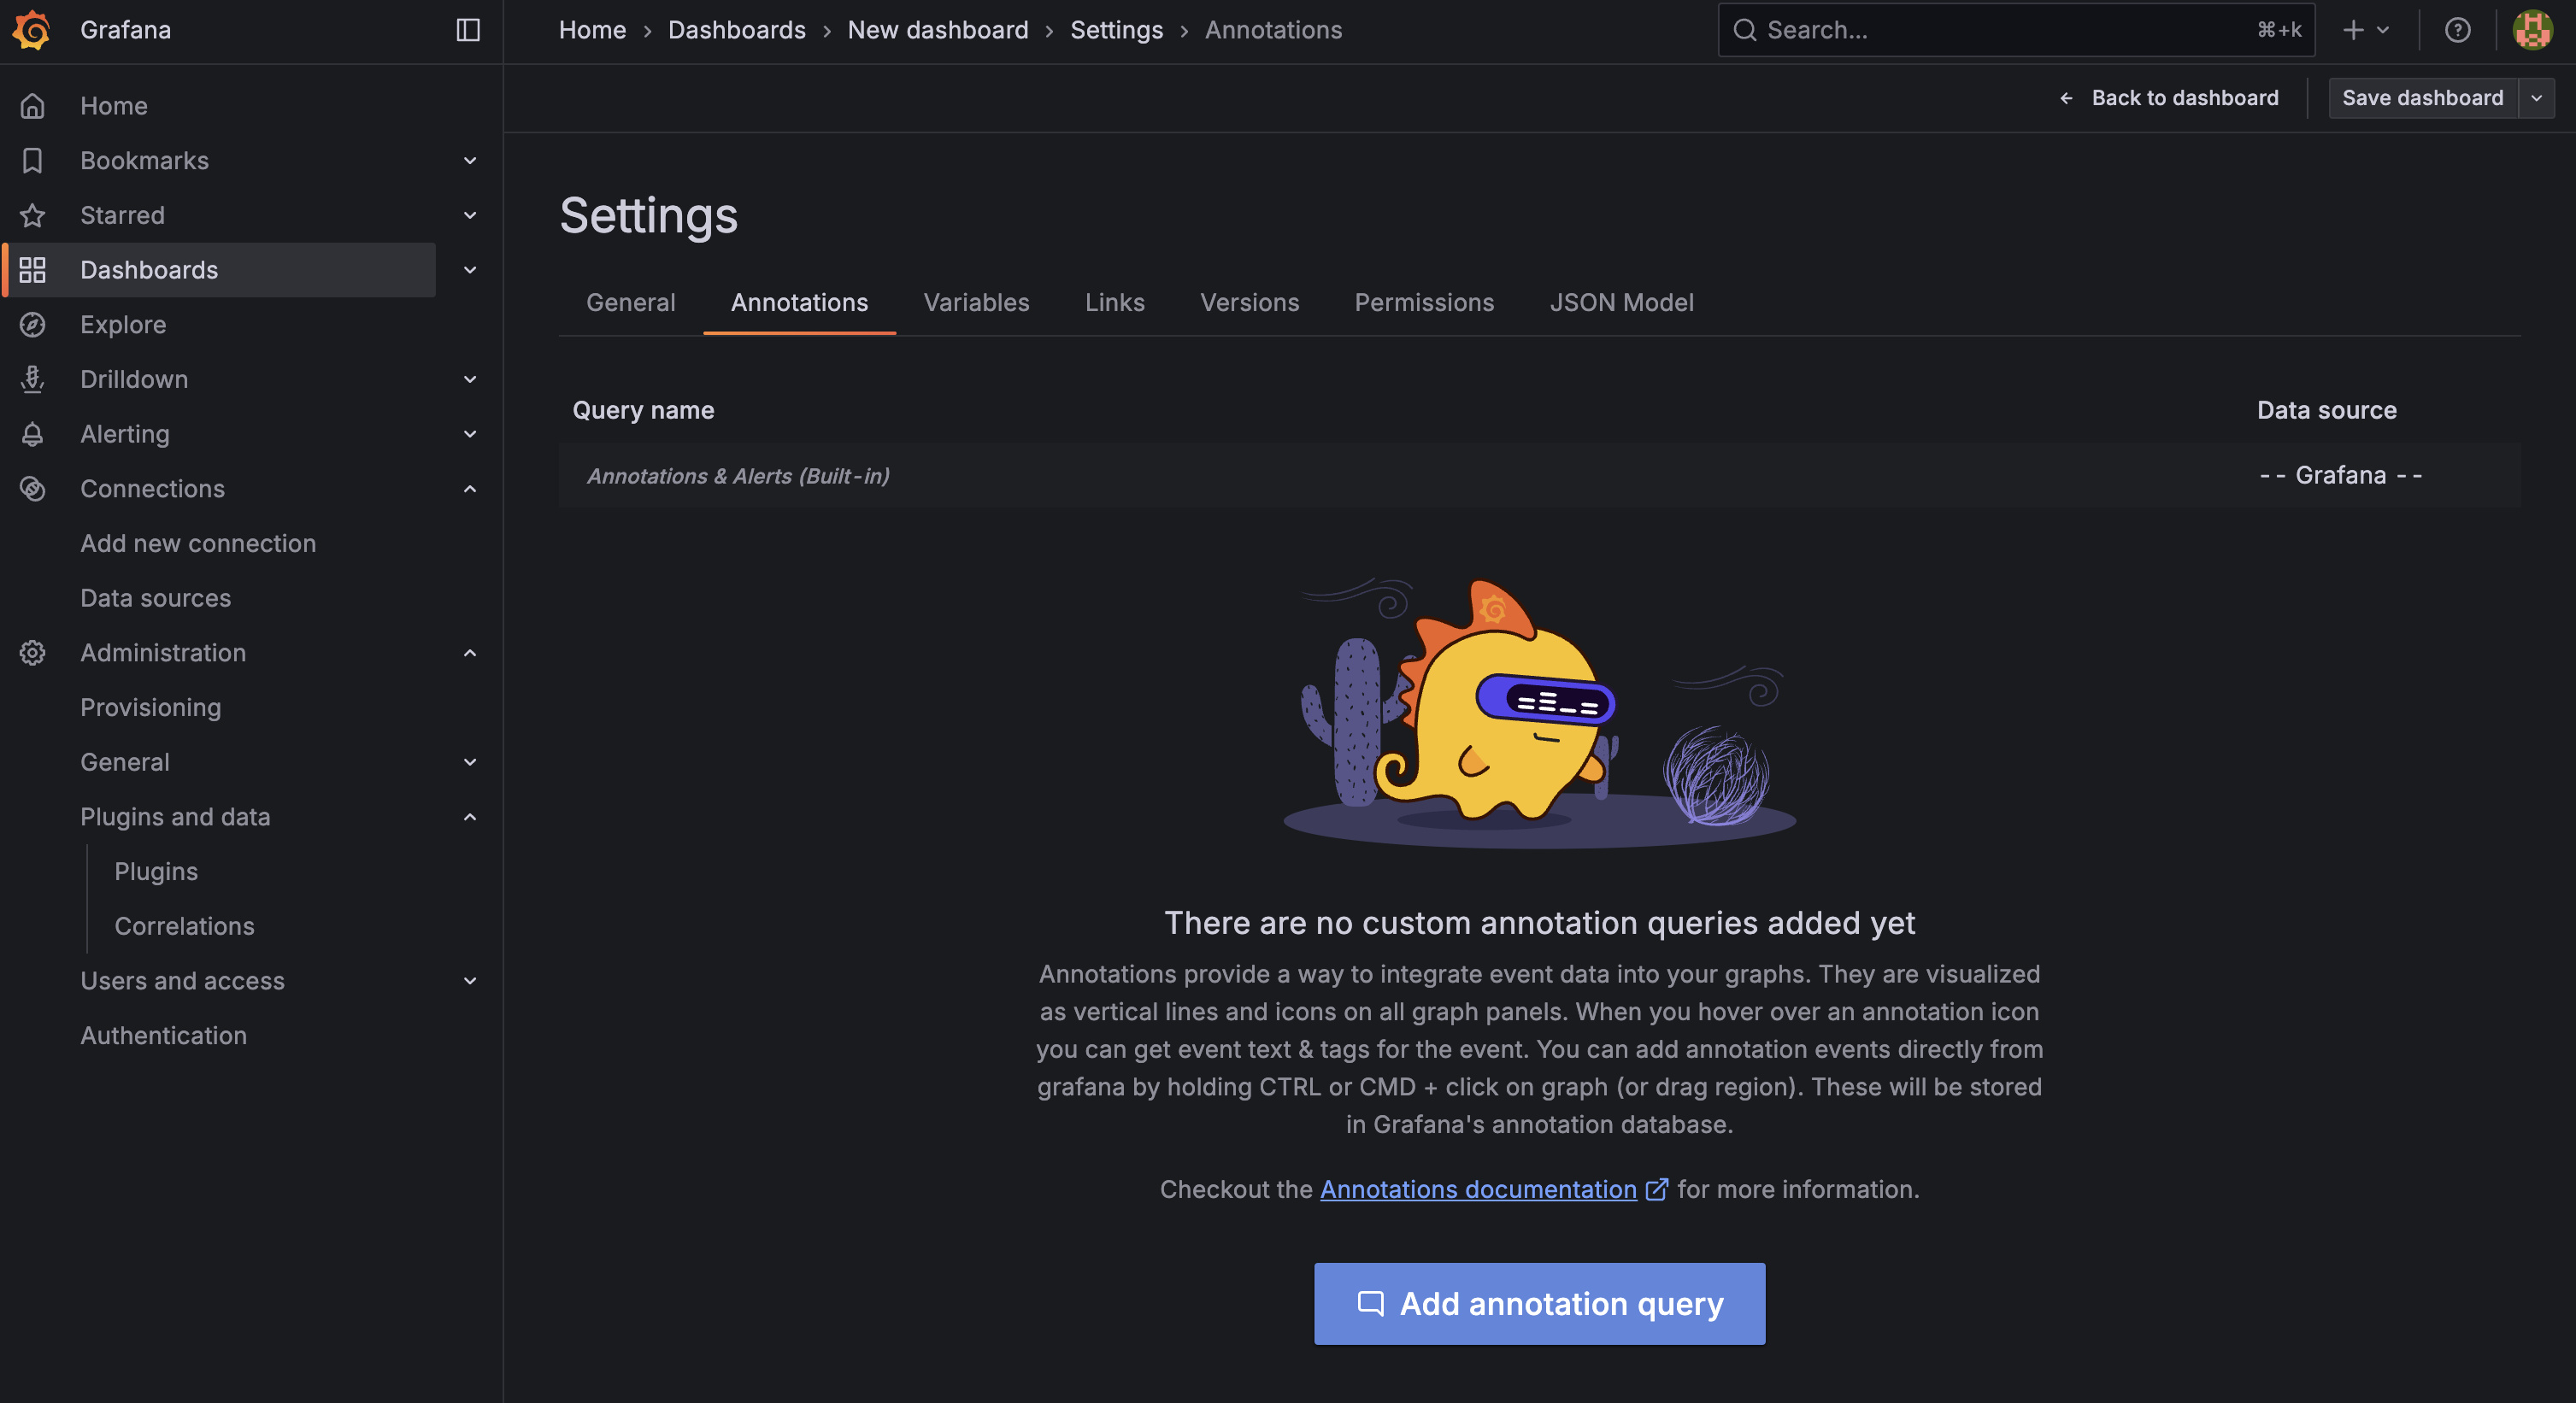
Click Add annotation query, and choose the Prequel data source, configuring the annotation as follows:
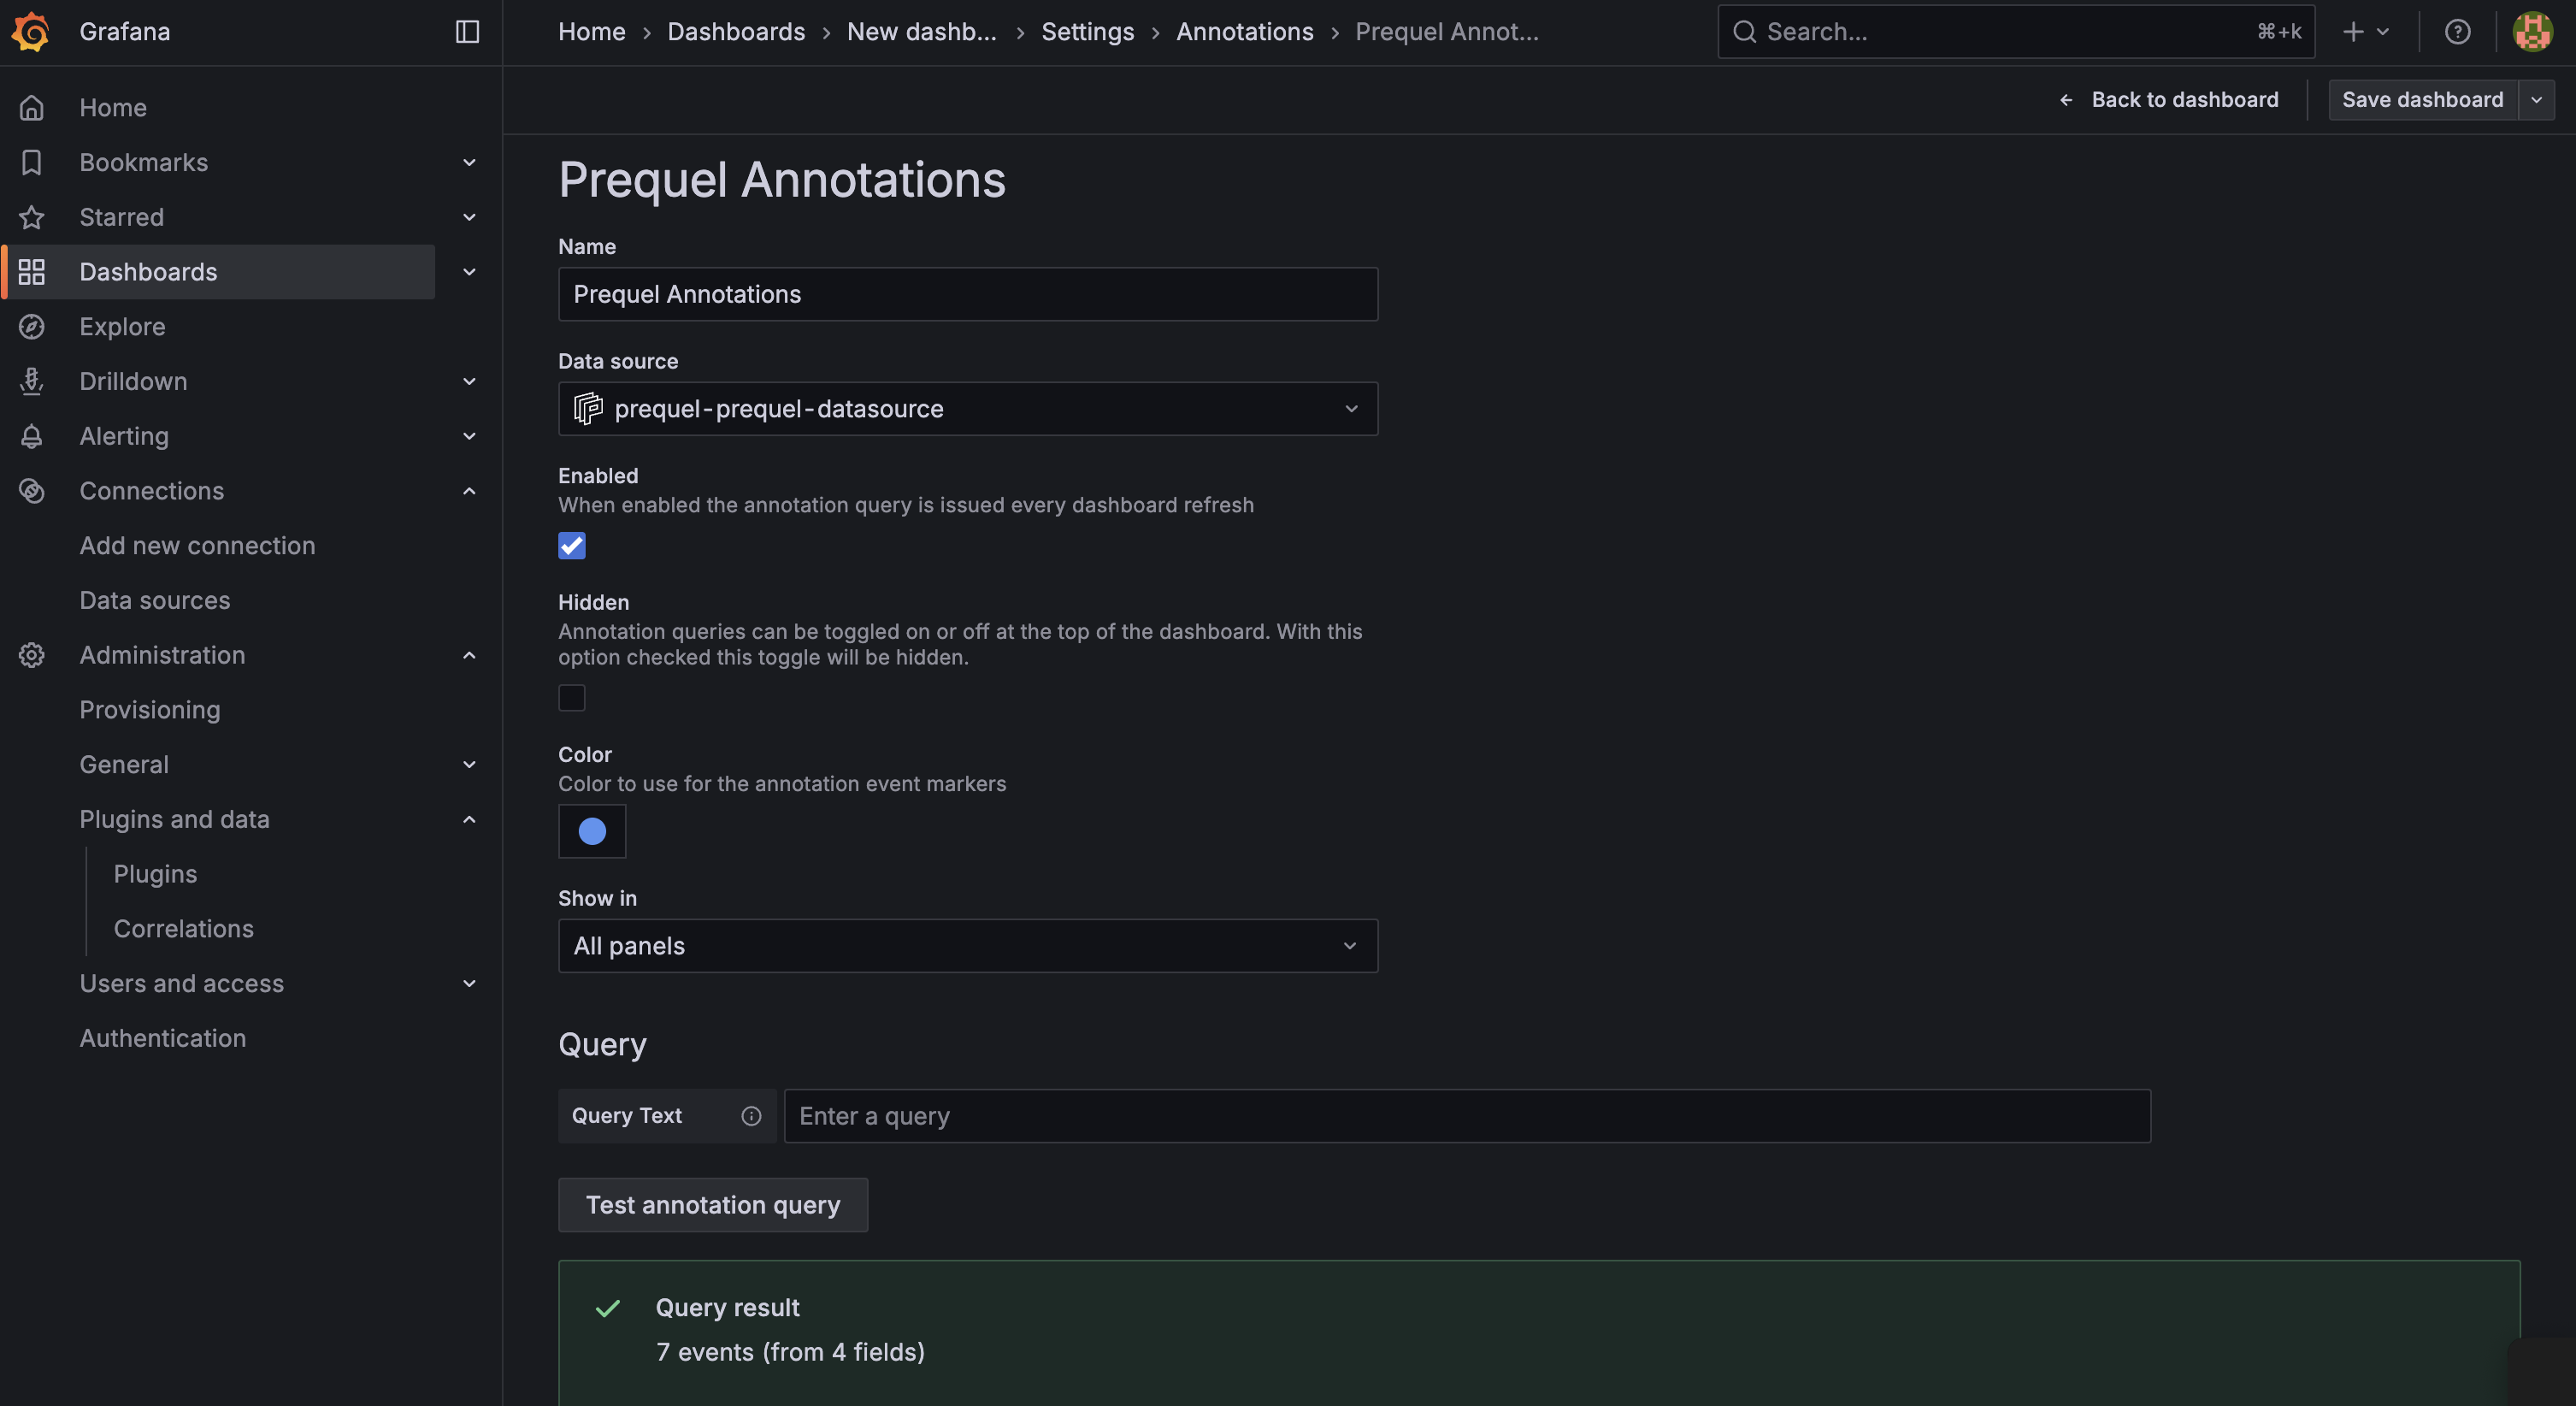
You should see a message confirming that the query worked.
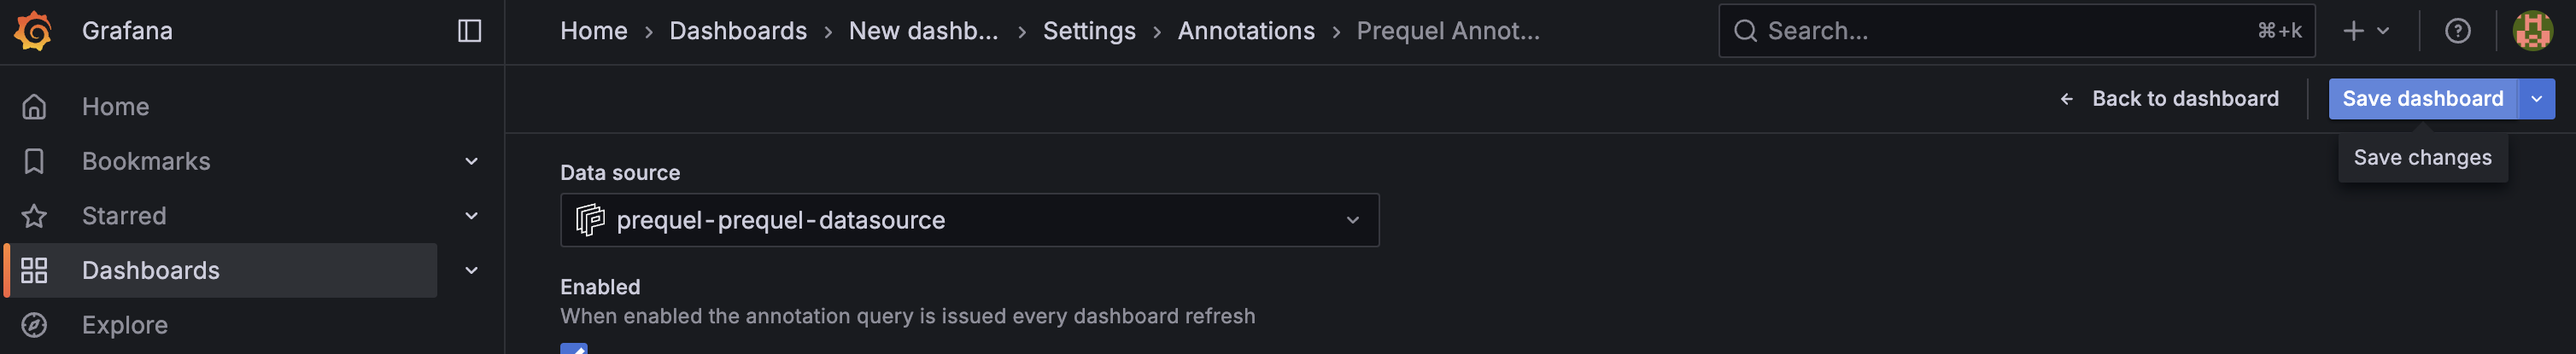
One you're done, click Save dashboard to persist the changes.
Then, click back to dashboard to return to the dashboard.
If there are detections that overlap with your panel's time window, you should start seeing annotation lines on your charts!
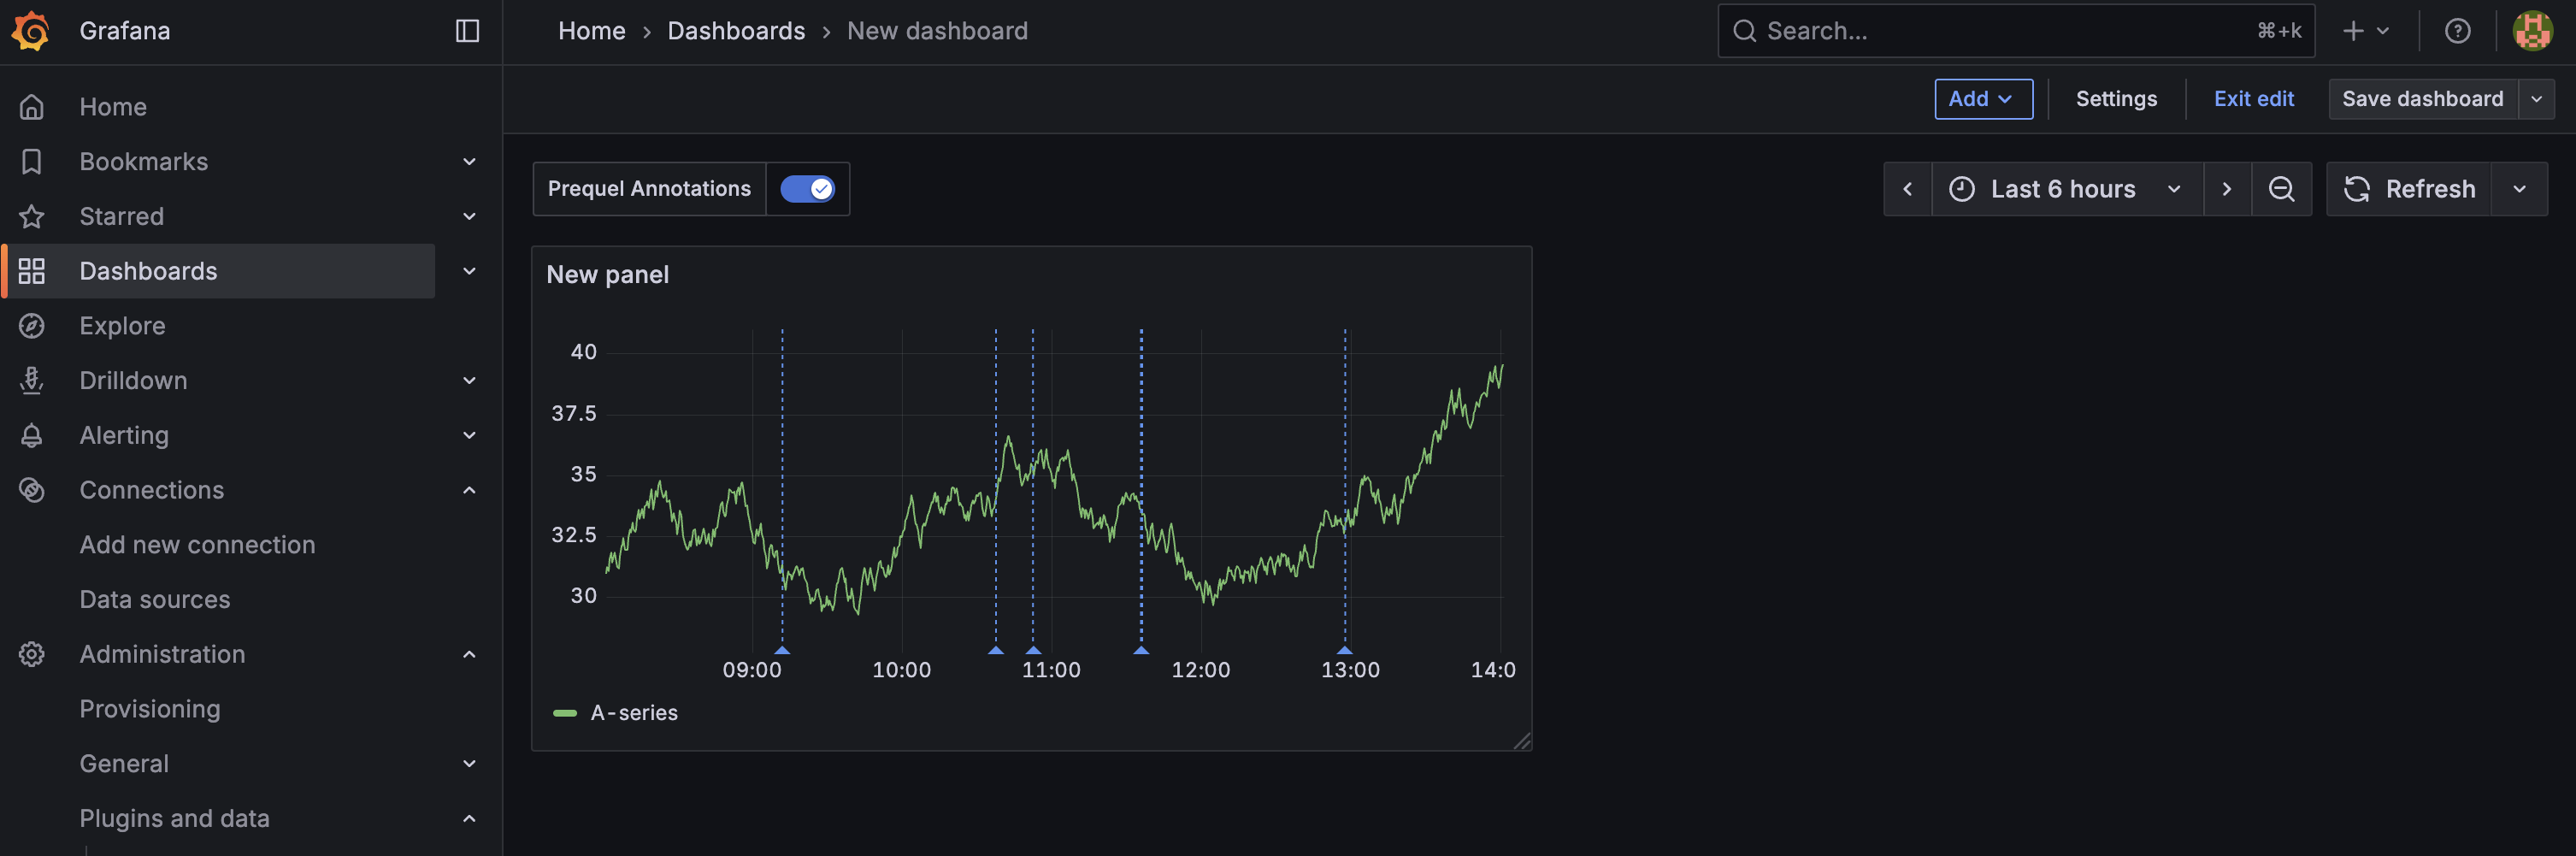
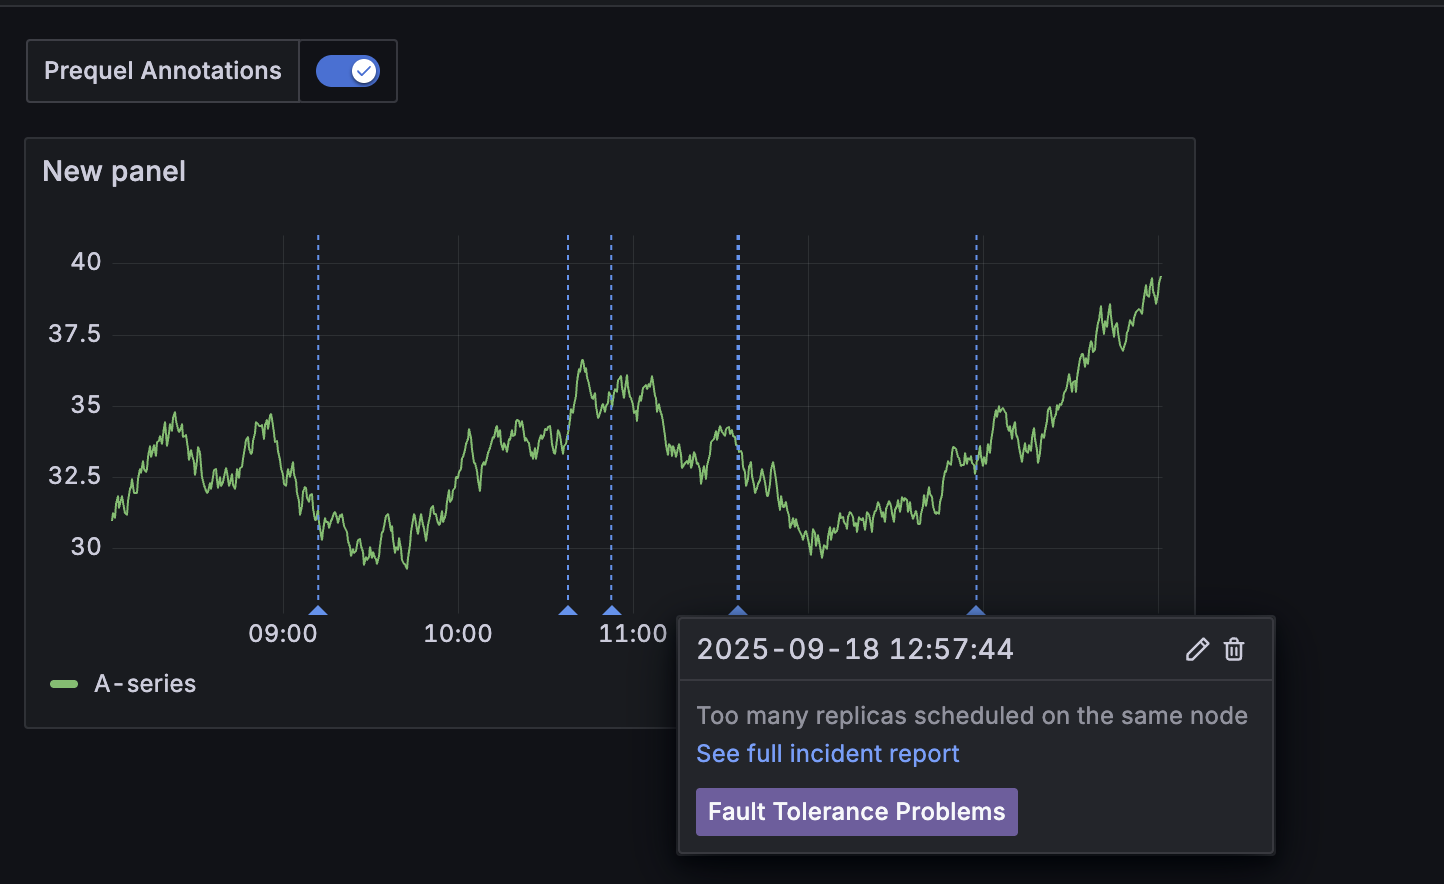
Clicking on any annotation line will show you the annotation details and give you the option to view the full detection in prequel.
✅ Congrats! Your Grafana instance is connected to Prequel. You can start visualizing detections as annotations on your dashboards.